How to read the 0DTE gamma-magnet overlay
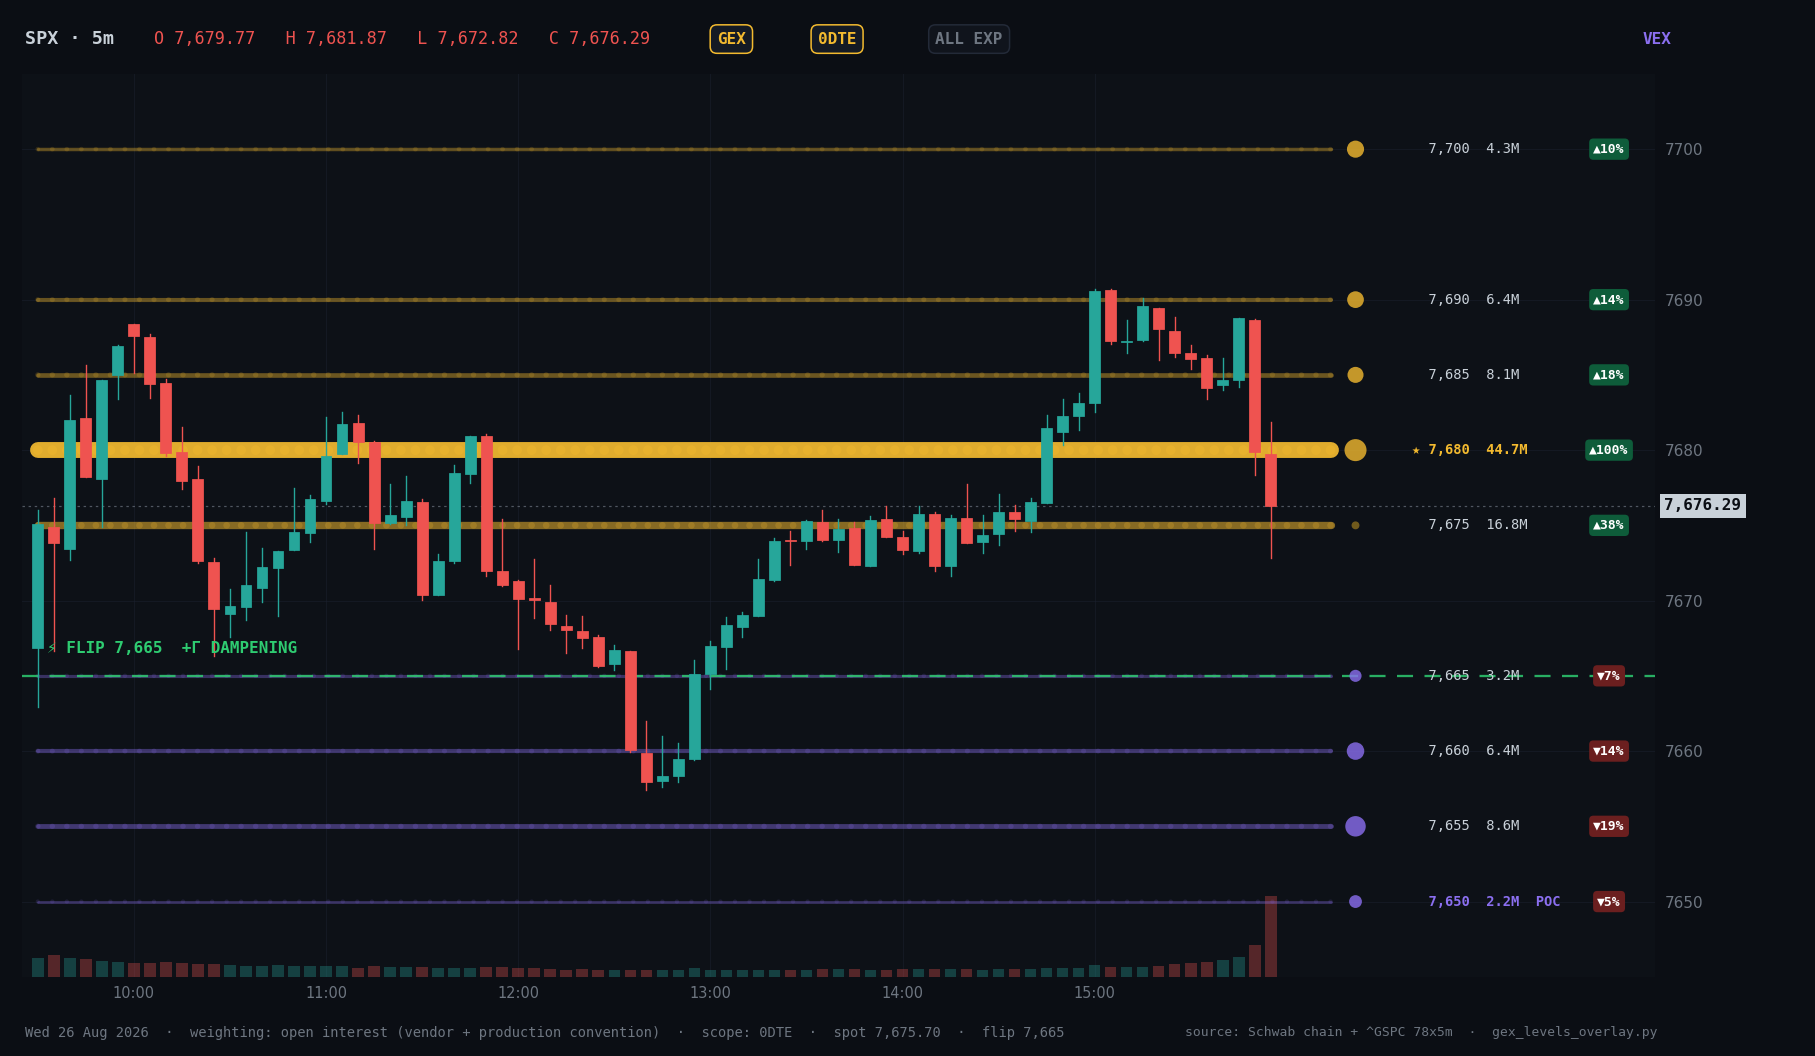
Every other GEX chart in this pipeline plots gamma on the strike axis. That answers where the gamma sits. It does not answer where price is sitting inside it, which is the question you actually have at 11am. This chart puts the ranked gamma concentrations on the price axis and lays today's candles over them.
What each part of the chart is
Hover a box to highlight it. The numbers match the key underneath.
Callout boxes are anchored to fixed regions of the layout, so they stay correct when the chart regenerates. The level rows themselves move.
- Last-bar readout Open, high, low and close of the final 5-minute candle, coloured green when the bar closed up and red when it closed down. This is the bar, not the session.
-
Scope pills
Which chain the levels came from.
GEXand0DTElit means the magnets are built from today's expiry only.ALL EXPlights instead when the chart is run with--all-exp, which pulls in the 0 to 60 DTE book and drags the levels toward round OpEx strikes. -
The magnets, and the flip
Horizontal lines are the five strongest positive-gamma strikes
(gold) and the five strongest negative-gamma strikes (purple), each drawn
at its own price. Thicker and brighter means stronger. Gold is where
dealer hedging leans against a move into the level. Purple is where it
leans with it. The dots along a line are one per 5-minute bar, each sized
by that strike's gamma at that moment, so a line fattens where the magnet
was actually strong and thins where it was not. A 0DTE strike's gamma
grows as time runs out only while price stays near it, and collapses once
price walks away, which is why levels have arcs rather than flat weights.
The dashed green line labelled
FLIPis the strike where per-strike net gamma changes sign: above it the book is net dampening, below it net amplifying. - VEX column One dot per level, sized by net vanna exposure at that strike, which is how much dealer delta shifts when implied volatility moves. Size is relative to the largest vanna on the chart, not an absolute scale. A fat dot on a level means that magnet is sensitive to an IV move, so it can weaken or strengthen without price going anywhere.
-
Level labels
Strike, then gamma at that strike in millions of dollars per one
point of SPX. The star marks the largest magnet of the day.
POCtags the strike carrying the most total open interest, which is often not the strongest gamma strike. - Strength badges Each level as a percentage of the largest magnet, so the star always reads +100%. The sign is the sign of gamma at that strike, green for positive and red for negative. It is not a price direction. This is the number to look at before the dollar figure: a second level at 38% is a real speed bump, one at 10% is scenery.
- Price axis Standard right-hand scale. The boxed value is the last close, with a dotted line across the chart at that level.
-
Volume
Share volume of the S&P 500 constituents, from yfinance's
^GSPCfeed, scaled into the bottom of the pane. This is cash equity volume, not SPX options volume, and no options volume appears anywhere on this chart. Read it as broad participation in the index, so you can tell whether a test of a magnet came on real flow or on nothing. - Provenance Date, weighting, scope, spot and flip strike, plus the data sources and the script that drew it. Check the weighting before comparing two of these charts, because the magnitudes are not comparable across weightings.
Anatomy of one level
Every magnet carries the same four pieces of information. Schematic, not to scale.
Read it in this order
- Find the flip line first. Price above it means the book is dampening: moves into the gold levels should decelerate. Price below it means the book is amplifying, the gold levels above are not holding anything up, and the purple levels below are accelerants rather than support. Everything else on the chart is read differently depending on which side you are on.
- Then the star. One level is usually several times the size of the rest. That is the session's centre of gravity, and price tends to spend more time near it than anywhere else on the chart.
- Then the badges, not the dollar figures. The percentages tell you which of the remaining levels are real. The ones far down the scale are scenery, and clustering matters more than any single level: several mid-ranked levels stacked a few points apart form a zone rather than separate lines.
- Then where price actually went. Did the candles stall at the gold lines and turn, or cut through them without pausing? A magnet that price sliced through is telling you the book is not being defended today, which is more informative than the level itself.
- Check the VEX dots last. A big dot flags a level whose strength depends on IV holding still. On a day when IV is moving, treat those levels as softer than their badge suggests.
Worked example: the sample chart
The levels on 26 Aug 2026, as the chart drew them.
| Strike | Gamma ($/pt) | vs #1 | Role |
|---|---|---|---|
| 7,700 | +4.3M | 10% | upper scenery |
| 7,690 | +6.4M | 14% | weak ceiling |
| 7,685 | +8.1M | 18% | weak ceiling |
| 7,680 ★ | +44.7M | 100% | call wall, centre of gravity |
| 7,675 | +16.8M | 38% | second magnet |
| 7,665 | n/a | n/a | flip strike |
| 7,660 | -6.4M | 14% | accelerant below flip |
| 7,655 | -8.6M | 19% | put wall |
| 7,650 | -2.2M | 5% | POC, highest total OI |
Read in the order above: price opened at 7,666.88, immediately above the 7,665 flip, so the dampening read was on from the first bar. The star sat at 7,680 with the next real level at 7,675 (38%) just below it, and nothing above 18% overhead. That frames a corridor from the flip up to the call wall.
What the session did with it, measured on the 78 five-minute bars:
| Observation | Value |
|---|---|
| Closes inside the 7,665 to 7,680 corridor | 53 of 78 (68%) |
| Closes below the 7,665 flip | 4 of 78 |
| Session low | 7,657.41 at 12:40 ET |
| Bars trading through 7,675, the 38% magnet | 28 of 78 |
| Session high | 7,690.73 at 15:05 ET |
| Bars trading through 7,690 | 3 of 78 |
| Last close | 7,676.29 |
Two thirds of the day closed inside the corridor. The one excursion below the flip bottomed at 7,657.41, which stopped 2.4 points above the 7,655 put wall and turned. The late push tagged 7,690 and held there for three bars before fading back, which is what a 14% level looks like when it does hold. Price finished at 7,676.29, sitting on the 38% magnet.
That is one session described after the fact, not evidence the levels caused any of it. A corridor that contains 68% of closes is also roughly what you would expect from a quiet 33-point range with a 15 VIX. The chart earns its place by framing the day, not by predicting it.
Where the per-bar dots come from
They are computed, not polled. Black-Scholes gamma goes as
phi(d1) / (S · sigma · sqrt(T)), so for a 0DTE strike it climbs
steeply as expiry approaches, but only while spot is still near that strike.
Everything needed to evaluate it at each bar is already in hand: spot from
the candles, time left from the clock, and open interest plus IV from the
single chain snapshot. No extra API calls, and it works on any past session
a snapshot exists for.
Today's numbers make the size of the effect concrete. Holding open interest and IV fixed at 12%, so the only things moving are spot and time left:
| Time | Spot | 7,665 | 7,675 | 7,680 | 7,690 |
|---|---|---|---|---|---|
| 09:30 | 7,675.08 | 1,466 | 1,590 | 1,560 | 1,334 |
| 12:40 | 7,657.94 | 2,061 | 1,418 | 1,047 | 454 |
| 14:00 | 7,673.39 | 2,389 | 2,849 | 2,563 | 1,410 |
| 15:45 | 7,688.79 | 0.07 | 160 | 1,646 | 7,854 |
7,690 grows 5.9 times into the close because price finished on it. 7,665 falls to essentially zero because price left it. Nothing in the option book changed to produce either. That is the whole mechanism, and it is why this view shows the magnet sharpening onto one strike while the static version cannot.
The modelled curve gets the shape right but not the level, because it holds IV at one snapshot value and real 0DTE IV moves. From 27 Aug 2026 the pipeline records the true per-strike gamma at every scheduled run, so the curve is rescaled to pass through those readings: shape from the model, level from the measurements. On any earlier session, and on any strike with fewer than two captures, it stays purely modelled and runs a little hot into the close.
What this chart will not tell you
The levels are yesterday's
Weighting is open interest, and OI is prior-close data. The chart is also regular session only, 08:30 to 15:00 CT. Across the ten scheduled runs on 26 Aug the 0DTE OI total returned only three distinct values and repeated them exactly, and the call wall moved once all day (7,700 to 7,680 between 09:00 and 09:30 CT) then held for five and a half hours. Expect the magnets to be fixed after the first hour. If they are churning, that is a near-tie between adjacent strikes, not new positioning.
FLIP is not the Volatility Trigger and not Zero Gamma
Three different levels, three different definitions, routinely 20 to 30
points apart. FLIP here is the strike where per-strike net
gamma changes sign. The profile charts report Zero Gamma, the interpolated
zero-crossing of the Black-Scholes cumulative profile, and VT, where
positive gamma decays below 20% of peak. Do not read one as confirmation of
another.
Magnitudes are weighting-specific
The same 7,680 strike reads 44.7M open-interest weighted and 2,568.7M volume weighted, because 0DTE volume runs roughly fifty times OI late in the session. Both describe the same book. Only compare charts that name the same weighting in the footer.
Not a signal. Dealer gamma positioning is inferred from the option chain, not observed. The dealer-long-calls, dealer-short-puts convention behind the sign is an assumption, and it is wrong for any strike where the flow was retail selling calls or institutions buying puts. Treat the levels as a map of where hedging pressure is likely to concentrate, and size positions off your own risk, not off a badge percentage.